Back to Blog
2026-09-27
11 min read
Jev looked underconfident on Banking77. Two of my labels were the reason.
I asked TypeSafe's Jev one yes-or-no question about a thousand public messages and checked whether its percentages matched what actually happened. On scam text messages they did. On bank support messages they looked far too cautious, until I read the messages themselves. The problem was two of my labels, not Jev.
When a weather forecast says 30 percent chance of rain, it should rain on about three of every ten days it says that. If it rains on nine of those ten days, the forecast is too cautious. If it rains on none, it is too alarmed. Forecasters call this being calibrated: the percentages mean what they say.
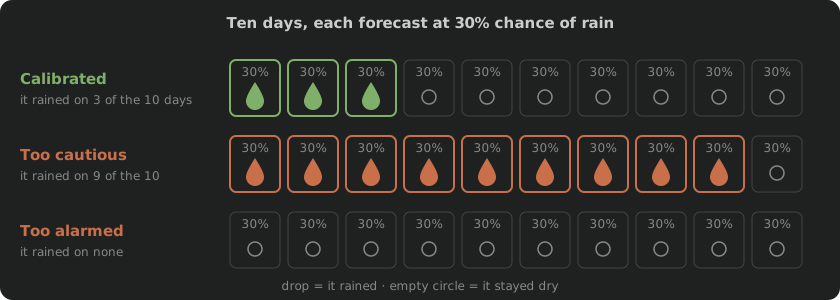
I wanted to know whether that holds for Jev, a model from TypeSafe that answers yes-or-no questions with a percentage instead of a yes or a no. So I asked it one question about a thousand public messages and compared its percentages with what the messages actually were.
On one set of messages, it looked badly miscalibrated. Where Jev said 20 to 50 percent, the real answer turned out to be yes almost nine times in ten. That looked like a forecaster saying "probably not" before a week of rain. Then I read the messages, and the mistake was mine.
What Jev says it does
Jev does not chat, write or explain itself. You give it some text and a question, and it returns a number. For a yes-or-no question, TypeSafe's docs define that number as the probability that the answer is yes.
When I explain it to people, I say you don't talk to Jev. You write the test it takes. Think of the fill-in-the-bubble exams from school, the Iowa tests or an SAT answer sheet. Your job is to write the question and the answer choices. Jev fills in the bubbles, except that instead of filling in one, it tells you how likely each choice is. A yes-or-no question is a test with two bubbles. With Jev, the work is in writing the question, not in a conversation.
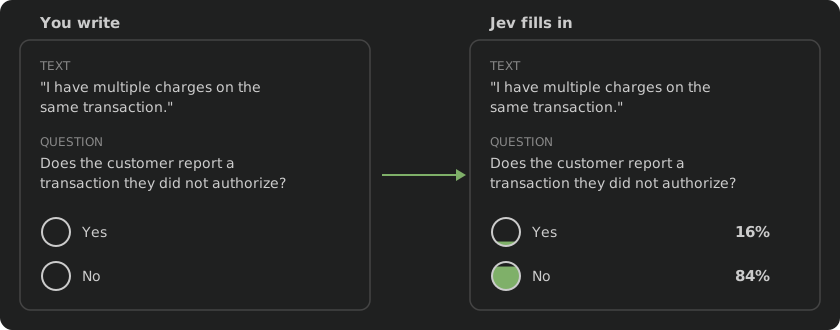
TypeSafe says its models are "trained for calibrated decisions", and it is careful about what that promises: "Calibration is measured across groups of predictions; it does not guarantee that an individual answer is correct." One message scored at 30 percent can be yes or no. But across a large group of messages scored near 30 percent, about 30 percent should be yes. A group is something I can check.
The test
I used two free public datasets where people had already labelled every message.
- DIFrauD: text messages, each labelled scam or not. I asked Jev: "Is this message a scam, phishing or social-engineering attempt?"
- Banking77: short messages people send to a bank's support desk, sorted into 77 topics such as "card arrived" or "exchange rate". There is no scam label here, so I made one. I picked six topics that sounded like "someone took money I did not agree to" and counted them as yes. I asked Jev: "Does the customer report a transaction they did not authorize?"
Then I sorted Jev's answers into ten buckets: 0 to 10 percent, 10 to 20, and so on. For each bucket I compared the average percentage Jev gave with how often the answer was really yes. The average gap across all buckets is the calibration error. Zero would be perfect. I also measured something simpler: whether Jev at least scored the yes messages higher than the no messages. Call that the sorting score. 1.0 means every yes message scored above every no message.
The scam texts: close to the forecast
On the 500 text messages, Jev behaved like a good forecaster. The average gap was 7 percentage points, and the sorting score was 0.995.
The extremes were clean. Jev put 369 messages below 20 percent, and not one of them was a scam. It put 47 messages at 90 percent or above, and 46 of them were.
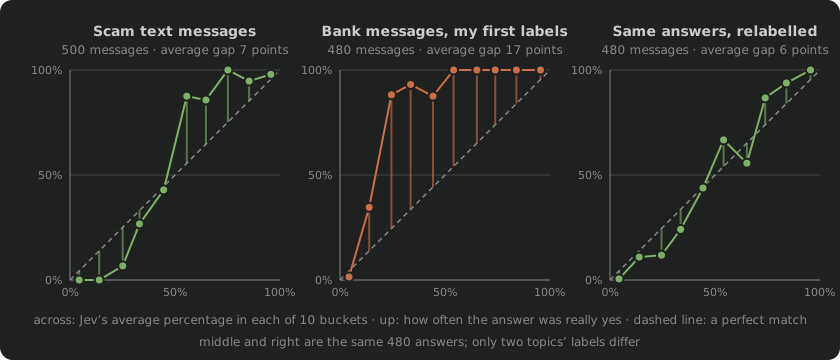
In the chart, Jev's percentage runs along the bottom and the real share of yes answers runs up the side. A dot on the dashed line means Jev's percentage matched reality for that bucket. A dot above the line means more yeses than Jev predicted. The left panel stays close to the line. The small wobbles in the middle come from small buckets: a few buckets hold only 7 or 8 messages, so one message moves the result by more than 10 points.
The bank messages: a forecaster saying "probably not" before the rain
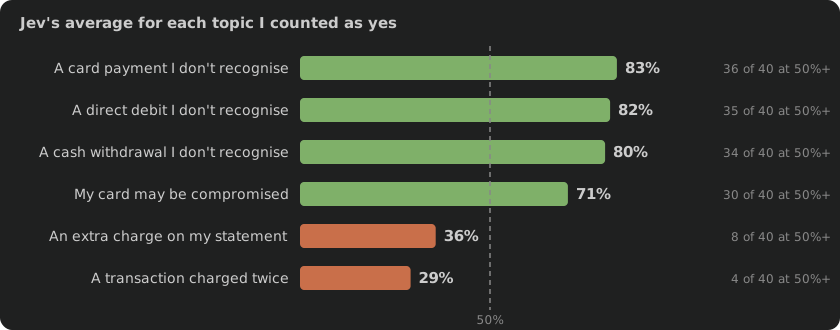
On the 480 bank messages, the sorting score was still excellent at 0.986. Jev put the yes messages above the no messages almost every time. But the percentages themselves were off, with an average gap of 17 points, and always in the same direction. None of the no messages scored 50 percent or more. But 93 of the 240 yes messages scored below 50 percent. Jev looked too cautious, as the middle panel shows.
Splitting the yes messages by topic showed where the gap came from. Four topics matched what I had asked about. Two did not. Each topic had 40 messages:
Reading the messages
Here are six messages from those two topics. My answer key said yes to every one. Jev's percentage is beside each:
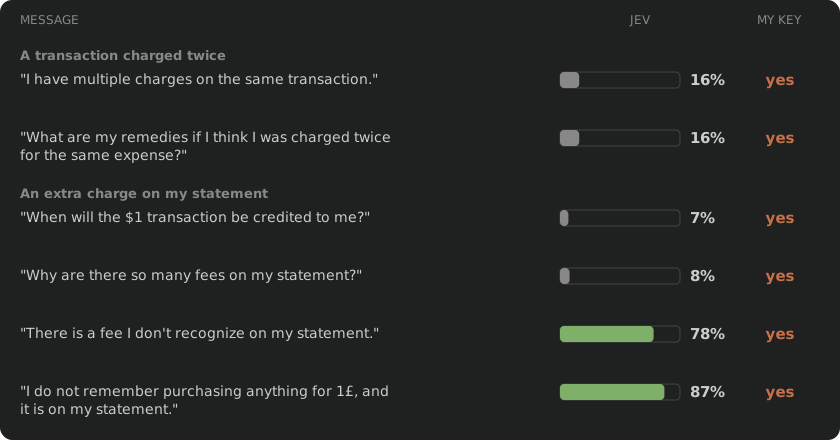
Someone who was charged twice agreed to the purchase. They are reporting a billing mistake, not a transaction they never made. Jev said "probably not", and for the question I asked, that is the right answer. My label said yes.
The "extra charge" topic is more mixed, and Jev kept up with it message by message. The two about a fee or purchase the customer does not recognise scored high. The two questions about a refund and about fees scored low. My label treated all 40 the same because they share a topic name.
In test terms, Jev answered the question printed on the page. The answer key I graded it with was written for a slightly different question.
The same answers, counted fairly
I kept every one of Jev's 480 answers and changed only my labels, counting those two topics as no. The average gap fell from 17 points to 6, which is better than on the scam texts. That is the right-hand panel of the chart.
I owe you one caveat about that 6. I chose to relabel those two topics after seeing the results, and I checked the fix on the same answers. It is not a fair new score for Jev. What it does show is that most of the 17-point gap came from my labels answering a different question from the one I asked Jev.
A third topic is borderline too. A compromised card does not always mean a transaction the customer did not make, and Jev put 10 of those 40 messages below 50 percent. I left that topic as yes. If I kept moving topics until the number looked good, I would be tuning my labels to flatter the model.
What the two scores told me
The only thing I changed was two topics' labels. Here is what that did to each score:
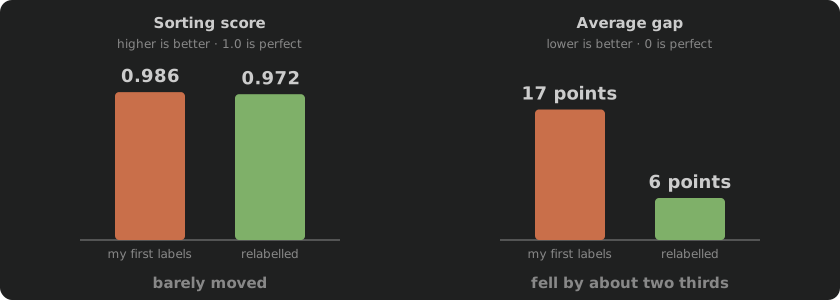
So the first result was not a measurement of Jev on its own. It measured Jev's answers against my idea of what the answers should be. On the scam texts, the labels came from the dataset's authors, answering nearly the same question I asked. On the bank messages they came from me, answering a slightly different question: which topics involve a charge the customer questions.
What this does not show
- This is two groups of about 500 messages, one run each. Several buckets hold fewer than 20 messages, which is small.
- The bank sample is half yes by design. In the full dataset, those six topics are 7.8 percent of messages, 240 of 3,080. A more natural mix would give a different number.
- DIFrauD has several kinds of text. I used only the text messages.
- The same messages sent three days apart gave nearly the same results: an average gap of 17 points both times on the bank messages, and 7 both times on the scam texts. A handful of messages moved between buckets.
For the curious
| What | Detail |
|---|---|
| Model | TypeSafe jev-1.13.0, called on 2026-09-27 |
| Client | judgevet 0.13.0, my Python client for Jev |
| Calls | 980, all successful |
| Scam texts | DIFrauD, MIT licence: 500 messages from the SMS test split, 98 of them scams |
| Bank messages | Banking77, CC BY 4.0 licence: all 240 test messages from my six topics, plus 240 others chosen with a fixed seed |
| My six topics | card_payment_not_recognised, direct_debit_payment_not_recognised, cash_withdrawal_not_recognised, compromised_card, extra_charge_on_statement, transaction_charged_twice |
| Average gap | Expected calibration error (ECE), ten equal-width buckets weighted by size: 0.073 scam texts; 0.174 bank messages as first labelled; 0.056 relabelled |
| Sorting score | AUROC: 0.995 scam texts; 0.986 bank messages as first labelled; 0.972 relabelled |
TypeSafe calls a yes-or-no question a Noul, so judgevet does too, and the
answer's .noul field is Jev's percentage as a number between 0 and 1. One
question is a few lines:
The 17-point gap came apart when I stopped looking at the chart and read ten messages from the buckets where it was widest.